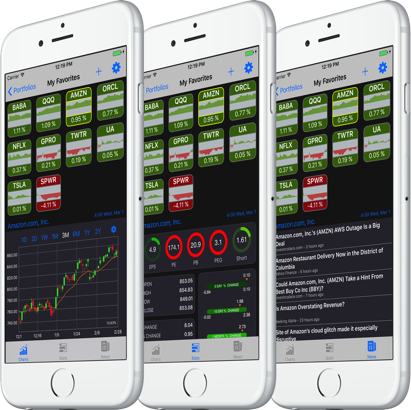
StockHop displays a portfolio as a collection of mini-charts in the top part of the screen and a selected stock’s details in the lower part. By displaying a portfolio this way, the user is able to evaluate hundreds of stocks in seconds, and drill in on a specific stock without losing the context of the other stocks. It’s a snap to compare multiple stocks, just by hopping back and forth between them.
StockHop is fully customizable. Create as many portfolios as you want with an unlimited number of stocks in each one. Organize your stocks into meaningful groups effortlessly. View your portfolios the way you want to see them in the order you want. And, with a breakthrough real-time intra-day stock-tile display system you can monitor the current state of hundreds of stocks with just a glance.
More importantly, with embedded mini stock charts you can see if the stock is up or down for the day, and also see which way the stock is trending in real-time. StockHop gives you dynamic circle charts for each stock so you can quickly evaluate and compare multiple fundamentals simultaneously.
FEATURES:
• Real-time quotes and charts.
• Quickly create as many portfolios as you want, and once created you can rename, reorder, and delete them.
• Scrollable mini-tile displays that can be set to show an area chart, a trend chart, or a text display.
• Selecting a stock tile updates the stock details in all the other displays. Quickly hop from stock to stock to investigate opportunities and compare values.
• Automatically saves the last selected stock in each portfolio, so you can resume right where you left off.
• Auto-update runs every minute to keep the app up to date. Also, at any time, you can pull down the stock-tile display to force an immediate update.
• Multiple chart styles to choose from (candle stick, area, line) with optional simple or exponential moving average lines.
• Available intra-day and multi-day charts for the following time ranges: 1 Day, 2 Days, 1 Week, 1 Month, 3 Months, 6 Months, 1 Year, 2 Years.
• Change the orientation of iPhone or iPad to get a full view of the chart, stats or news panels
• Use pinch-to-zoom to zoom charts both vertically and horizontally to show greater detail.
• Color of area and line charts change based on close price minus open price for the chart time period—green for a price gain and red for a price reduction.
• Key fundamental statistics, EPS, PE, PB, PEG, and Short Ratio are presented using color-coded circle charts. These charts make it possible to evaluate a stocks most important fundamentals in a glance.
• Complete set of performance statistics: Open, High, Low, Close, Change, Percent Change, Volume, Avg. Volume, Market Cap, EBITDA, Book Value, Dividend Yield, Earnings Per Share: This Quarter, Next Quarter, This Year, Next Year.
• Complete set of price percent change range bars: 5 Days, 15 Days, 1 Month, 3 Months, 6 Months, 1 Year, 2 Years. These can be used to compare price percent change volatility across stocks.
• A comprehensive news feed helps you correlate stock moves with global trends and news events.
Some icons were provided by Icons 8. icons8.com
Developed by Digital Beach Software, StockHop is a stock / equity tracking app, designed to help both novices and experts quickly find, evaluate and monitor stocks.